Skip to content

Charts

Charts can be embedded into reports with a <chart> component. The <chart> component uses ChartJS for rendering charts. The resulting chart is embedded as an image in the PDF.

How the chart looks like is specified by the :config argument. This argument accepts a ChartJS config object. You can configure different chart types (e.g. pie chart, bar chart, line chart, etc.), chart styling, labels. The config also takes the datasets to be rendered in the data property.

You can use all available ChartJS configuration options (except animations, since they are not possible in PDFs) to customize charts for your needs.

Other options:

  • width: Width of the chart in centimeter
  • height: Height of the chart in centimeter

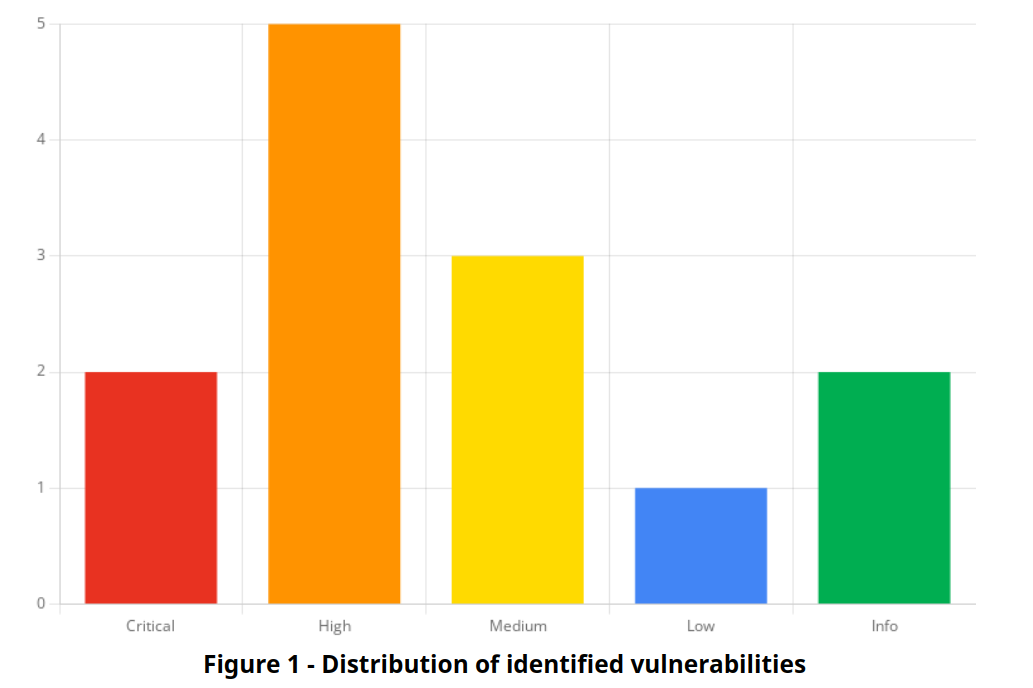
Example: Bar Chart of vulnerability risks

The following chart shows the number of vulnerabilities for each risk level (none, low, medium, high, critical) in a bar chart. Each risk level bar has a different color.

 1
 2
 3
 4
 5
 6
 7
 8
 9
10
11
12
13
14
15
16
17
18
19
20
21
22
23
24
25
26
27
28
29
<figure>
  <chart :width="15" :height="10" :config="{
    type: 'bar', 
    data: {
      labels: ['Critical', 'High', 'Medium', 'Low', 'Info'],
      datasets: [{
        data: [
          finding_stats.count_critical,
          finding_stats.count_high,
          finding_stats.count_medium,
          finding_stats.count_low,
          finding_stats.count_info
          ],
          backgroundColor: [
            cssvar('--color-risk-critical'), 
            cssvar('--color-risk-high'), 
            cssvar('--color-risk-medium'), 
            cssvar('--color-risk-low'), 
            cssvar('--color-risk-info')
          ],
      }]
    },
    options: {
      scales: {y: {beginAtZero: true, ticks: {precision: 0}}}, 
      plugins: {legend: {display: false}},
    }
  }" />
  <figcaption>Distribution of identified vulnerabilities</figcaption>
</figure>

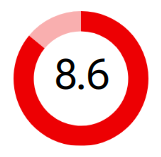
Example: Doughnut Chart of CVSS score

The following chart shows the CVSS score criticality as a doughnut chart with the score inside as number. The higher the score, the more of the chart area is filled.

 1
 2
 3
 4
 5
 6
 7
 8
 9
10
11
12
13
14
15
16
17
18
19
20
21
22
<div class="cvss-chart">
    <span class="cvss-chart-label"><span>{{ finding.cvss.score }}</span></span>
    <chart :width="5" :height="5" :config="{
        type: 'doughnut',
        data: {
            datasets: [{
                data: [
                    finding.cvss.score, 
                    10.0 - finding.cvss.score
                ],
                backgroundColor: [
                    cssvar('--color-risk-' + finding.cvss.level), 
                    cssvar('--color-risk-' + finding.cvss.level) + '50',
                ],
            }],
        },
        options: {
            borderWidth: 0,
            cutout: '70%',
        }
    }" />
</div>
 1
 2
 3
 4
 5
 6
 7
 8
 9
10
11
12
13
14
15
16
17
18
.cvss-chart {
  position: relative;
  width: 3cm;
  height: 3cm;
}
.cvss-chart img {
  width: 100% !important;
  height: 100% !important;
}
.cvss-chart-label {
  position: absolute;
  width: 100%;
  text-align: center;
  top: 50%;
  transform: translateY(-50%);
  line-height: 1;
  font-size: 25pt;
}

Plugins

ChartJS supports plugins to extend the functionality of charts.
We provide the following plugins:

Plugins are disabled by default. You can enable them using the plugins option in the config object of charts.

1
2
3
<chart :config="{
  plugins: [ chartjsPlugins.DataLabels ]
}" />